Cities are being overwhelmed by a top-down, algorithmically-enabled attempt to make them legible, quantifiable and replicable. Can a project of nonsense-making disrupt the seemingly inexorable march of "progress"?
To live in London is to live in what Mayor Sadiq Khan has called a “global “test-bed” city for civic innovation” in data and smart technology use. So Khan says in his 2018 Smarter London Together Roadmap, which, along with the subsequent 2021 Emerging Technology Charter, formalised a framework calling for smart city innovation driven by public/private partnership and citizen-centred development and deployment. As the Charter states: “data and technology provide value and benefit for individuals, communities, and society”.
This all sounds quite inclusive and participatory. But a closer look at the documents reveals a surprisingly hierarchical and deterministic form of citizen involvement. They call for Londoners to “have a voice” in the design of technology, for the creation of more digital “civic platforms”, greater diversity in tech, and improved digital literacy. But each time, the use of smart tech is taken as an inevitability, already decided. The role of citizens is at best to nudge its deployment. Overall, the language and ethos frame citizens as passive recipients of digital technocratic processes and any benefits these processes might achieve.
The Greater London Authority’s Datastore also demonstrates this ethos perfectly: we can go online and view graphs, dashboards, or charts tracking localised house prices, crime rates, and demographics on our phones and laptops. But seeing these visualisations doesn’t necessarily help us understand them, or the city they purport to represent. As citizens, it’s hard to grasp whether we are seen in that data, or how software seeks to make sense of our lives and homes let alone how we might avoid that vision altogether.
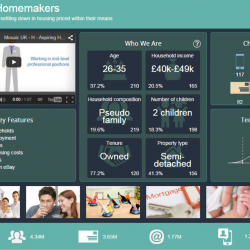
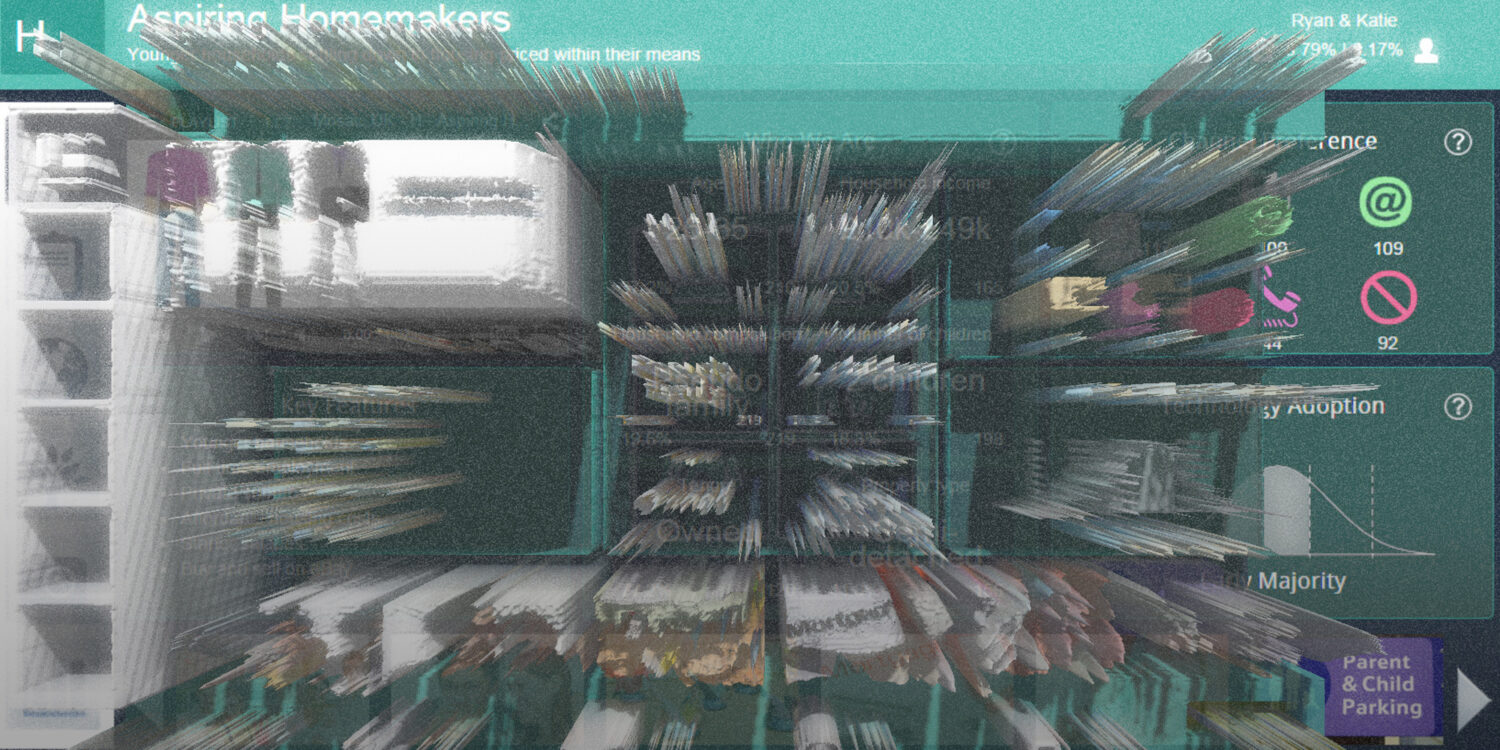
This becomes particularly clear considering that, in practice, datasets and algorithms are often proprietary secrets kept beyond public scrutiny or understanding, whether or not their designers sign up to voluntary charters. An early example is credit score company Experian’s Mosaic tool. It uses “850 million pieces of information… using the latest analytical techniques” to put every household into one of 66 different categories, from the “Metro High-Flyers” (“career-minded 20 and 30-somethings renting expensive apartments in highly commutable areas of major cities”), and “Inner City Stalwarts” (“Long-term renters of inner-city social flats who have witnessed many changes”), to the “Families on a Budget” (“Families with children in low-value social homes making limited resources go a long way.”) Mosaic’s patronising labels ignore the economic and social histories, systems, and tools (including credit scores!) that create inequalities, simultaneously producing a dataset and analytical tool that dispassionately adds or removes value from whole neighbourhoods.
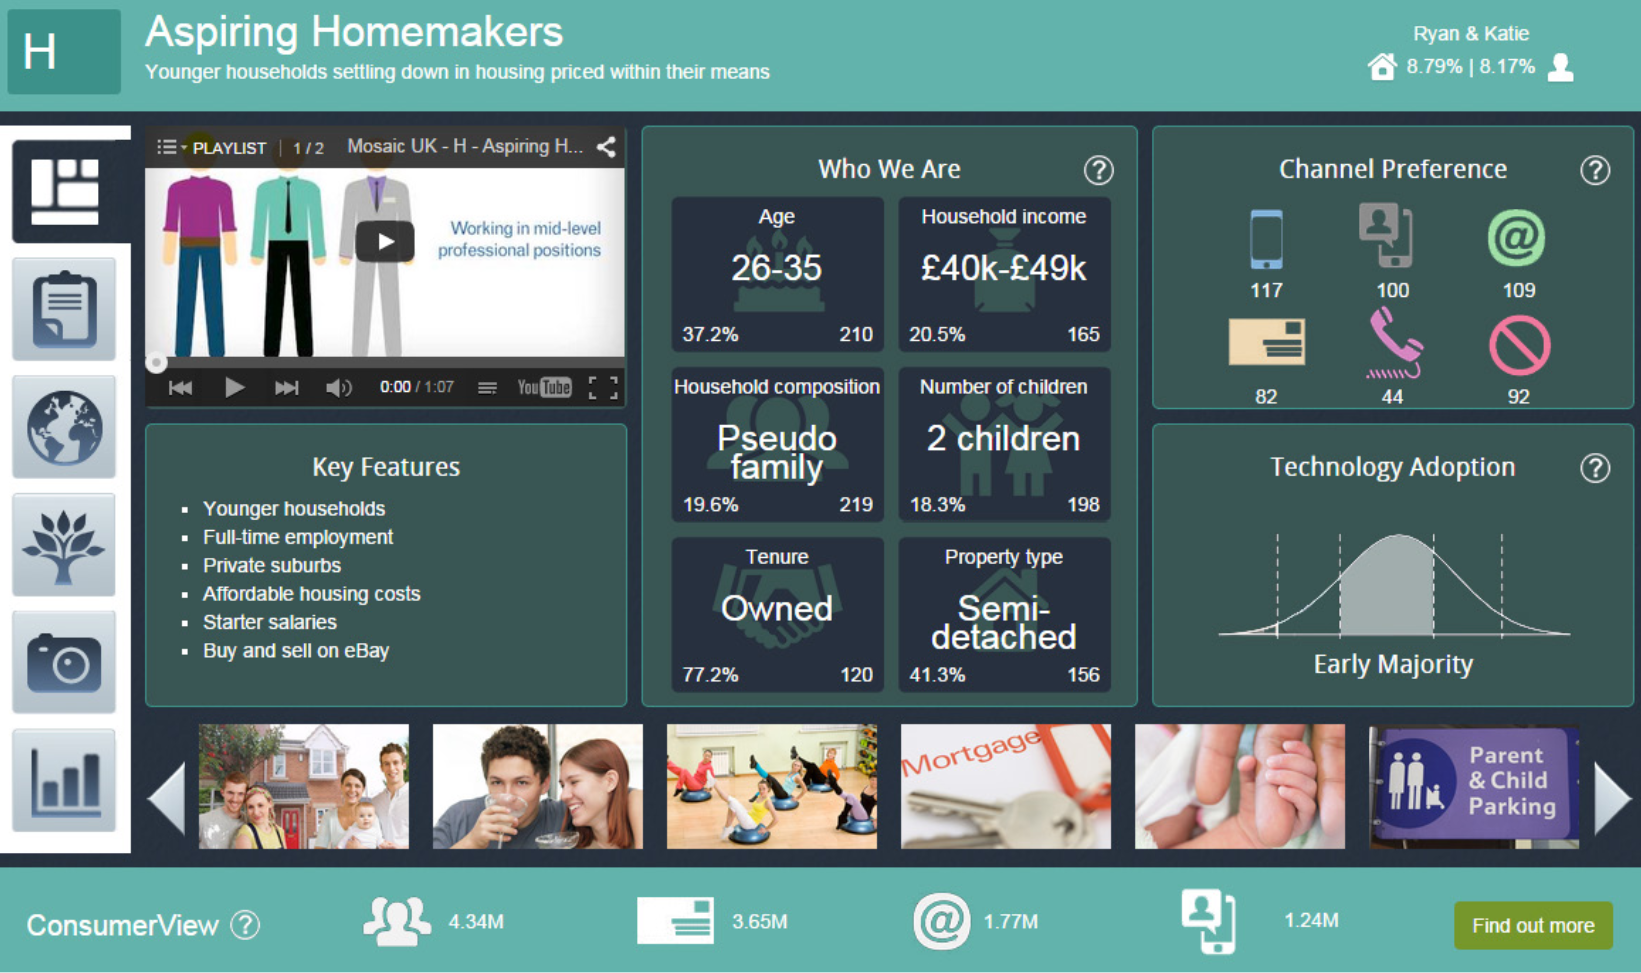
The now-disbanded Haringey Development Vehicle (a 50/50 public-private partnership between Haringey Council and LendLease) used Mosaic when producing a Place Strategy for the regeneration of Northumberland Park Estate, a 1960s estate adjacent to the stadium of Tottenham Hotspur football club. The tool assigned just under half (49.5%) of the area to the low income “Type K” group. Meanwhile, “Type N” (homeowners “that feel a real attachment to their neighbourhood”) and “Type O” (“a young and aspirational cohort… [that] are ambitious, adventurous… and contribute positively to the activation of the area”) accounted for 23.5% and 24.1% respectively. Still, it identified both N and O categories as target markets for the future development’s housing. It’s not clear whether Mosaic dictated decisions in Haringey. But demographic reports can easily be utilised to justify viability assessments: for example, by arguing a particular demographic must be targeted to guarantee a profit, developers can forgo the Section 106 payments that go toward social housing or other public benefits, as has happened innumerable times, perhaps most famously with the Heygate Estate.
People have no choice but to be measured and narrativised by these “God’s-eye view” tools. Whole catalogues of products in the ballooning PropTech sector establish grand visions for the visibility, quantification, replication, and steering of the city and its citizens; all based around ownership of space, and suggestions of what demographics belong in it. Companies such as Rightmove, Opendoor, and Zillow use data covering house prices, crime, transport, and culture to insert themselves as platforms within the housing market, their sheer scale raising the possibility of them beginning to control sufficient data to steer a general societal understanding of housing (although Zillow has found their ambitions abruptly checked by a mixture of Covid and labour shortage obstacles). Proportunity takes this to a perhaps unavoidable conclusion, with their Chief Executive claiming that their property value and trends algorithm has even “learned the concept [of gentrification] itself” to predict future high-value areas.
To most people, this is the experience of the algorithmic city: something done to us, and to our surroundings. The data gathering is invisible and forgettable, its processing and categorising happens in unknowable servers and the results are only available for purchase as a service. When we do have access to non-proptech urban software, it’s usually via apps or websites such as FixMyStreet or municipality service maps (for example, the interactive map of the London Borough of Lewisham); or through Uber or Google Maps, orienting the city around the user’s location. Each of these examples is consumer-focused, allowing us to demand services of the city, or find new services or places to spend money (even Khan’s charter adopts consumerist language, listing Londoners as a “user group”). But none of them let us see, or question, those long-term trends and decision-making processes focussed upon the city. Is data on housing prices, crime, or potholes really the most valuable information to have at our fingertips? Is it really the best way we can relate to our city?
Dressed up in eye-catching graphics and definitive forecasts, the algorithms driving these apps give the impression that they see the essence of the city and render it accurately. But we’re only really seeing it through the financialised language of their creators. Companies such as Canopy even offer services that encourage renters (likely, with a little coercion from their landlords) to adopt this logic themselves: by reporting their rent history to Experian, building a “RentPassport” that forever links you with both your urban and financial history. For many renters, likely living paycheck to paycheck, unable to refuse landlords’ insistence on using these services, their financial precarity becomes forever itemised and traceable across the city. By the simple act of renting, they create a steady, legible picture for computation.
An algorithm’s creator may succeed in concealing its workings, but they cannot conceal its impact when it is deployed. By quantifying and measuring cities against sweeping criteria, they make space exchangeable, and open it up to the placeless aesthetic of gentrification: WeWork or Pret opening a new branch on a street corner that their algorithm suggests as an “urban node”; transport routing prioritising this same corner; housing algorithms then swooping in to profit from the ensuing economic activity. One neighbourhood starts to look and work like another, the aesthetics of “successful” regeneration copy-pasted ad infinitum.
There are a number of projects seeking to arrest the seemingly inevitable march of algorithmically-enabled displacement, or even just increase our understanding of its opaque processes. The design research project Aesthetics of Exclusion has created StreetSwipe, which aims to crowdsource an image-based definition of gentrification, via a website that serves the viewer a randomised photo of a street or shopfront, and asks simply: “gentrified?”. This prompts the viewer to imagine what an algorithm would infer from the city’s innocuous, messy reality. StreetSwipe’s decontextualized street views reaffirm the placelessness of the gentrification aesthetic, and just how predictable and taxonomic its signifiers are.
But we can also imagine developers’ software looking at such streets and buildings, armed with their datasets of property prices and crime rates, and rapidly falling into logical fallacies. To build on an example offered by Adam Greenfield: imagine a statistically poorer neighbourhood in which fires or crime appeared more regularly. There’s a good chance the housing is older or in disrepair, and there’s almost certainly fewer gentrification-aesthetic coffee shops. Any of the software examples above could deduce that correlation equals causation, ignore the underlying causes of crime or fire safety (building quality, poverty, etc.) and conclude that already-gentrified areas are likely to be freer of fire or crime, and therefore “desirable”, profitable, and worth emulating. Mosaic and others recommend that cities be made to fit the “successful” mould, all that’s required is the displacement of existing residents and homes.
And when it comes to citizens, what software sees or doesn’t see is sometimes all too obvious. In 2019, for instance, the London Met police live-tested their facial recognition software, despite a reported accuracy rate below 20%. This is endemic in such software, with error rates for non-white, non-male faces much higher. Poorly built algorithms, ignorant creators, and skewed data makes white, cis-gendered, heteronormative bodies the norm, discarding others as outliers.
Many citizen groups have tried to grasp this computational process, instead of simply letting it happen to us. Citizen GIS mapping initiatives and hackathons suggest that we could make our own tools and software that could sit within that correlation/causation gap and better represent the local or the subjective experience. This is the best case for what Khan’s call for citizen involvement in tech design could mean. But these tools and representations still structure a data-driven, solutionist understanding of the city: an almost gamified ethos that imagines that key metrics can be improved, and the city’s problems “solved”, with supposedly-depoliticised management. Khan still courts Silicon Valley companies, and his Smart London Boardincludes tech entrepreneurs, angel investors, and financiers: it’s no real surprise that the Tech Charter speaks of the smart city as a foregone conclusion. As a Londoner engaging with these systems, then, no matter your intentions, you’re still playing the same game with the same tools. Maybe no algorithm, app, or dataset is the right approach.
Legacy Russell notes that “demanding legibility is a strategy of the state”. To make data and software of our own is to provide that legibility. Exploring the socio-techno construct of gender and sexuality, she sets out an alternative in her book Glitch Feminism, arguing that there’s real potential in embracing the illegible, outlier status of non-normative bodies or communities and encouraging people “to disappear between ticked boxes, fail at forms, throttle the predictability of auto-play…” We cannot know when computer sensors are monitoring us or our neighbourhoods. We can only assume that this surveillance is constant.
Perhaps we can expose data’s inability to see or programme us truthfully by celebrating refusal, taxonomic uncertainty, the nonperformance of behavioural or data-legible practices, and the creation of nonsense in our meeting and engagement with day-to-day and urban-managerial software. This means purposefully finding actions and habits by which we achieve that encryption: constantly disrupting the steady, algorithm-legible image; actions, aesthetics, and interfaces that refuse their commercial language and disable data-parsing.
One example Russell cites is Zach Blas’s Facial Weaponization Suite, a “glitch-resist” that seeks out the systemic oversights of computer vision software with masks designed to hide the wearers from cameras, injecting nonsense (glitch) data into the process. On one mask, Blas “explores a tripartite conception of blackness: the inability of biometric technologies to detect dark skin as racist, the favouring of black in militant aesthetics, and black as that which informatically obfuscates.” Russell writes how the masks “reject singularity and embrace collective action,” by identifying the bodies and locations most vulnerable to algorithmic vision and making this a core component in a strategy of denial and empowerment in urban space. This and similar examples such as Ewa Nowak’s anti-AI jewellery or Adam Harvey’s Dazzle Paint (designed to combat a specific algorithm, the haarcascade face detection software) suggest a method to perform the glitch throughout the city. For the home, designers and software developers have created devices and software that generate a stream of automated nonsense data to cloud your search history, social media usage, and even audio recordings, thereby terminally diluting the value extraction potential of the domestic space.

But glitches needn’t stop at the level of the individual. The anti-facial recognition masks, paint, and jewellery provide in-the-moment protest against, and protection from, policing surveillance. But a concept such as micha cárdenas’s Local Autonomy Networks (Autonets) suggests an evolution in which wearable fashion becomes a mesh-network-enabled communication device capable of alerting all members of a group when one person is in need of help, while also being undetectable by most data-gathering methods.
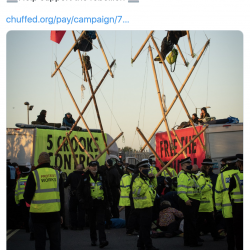
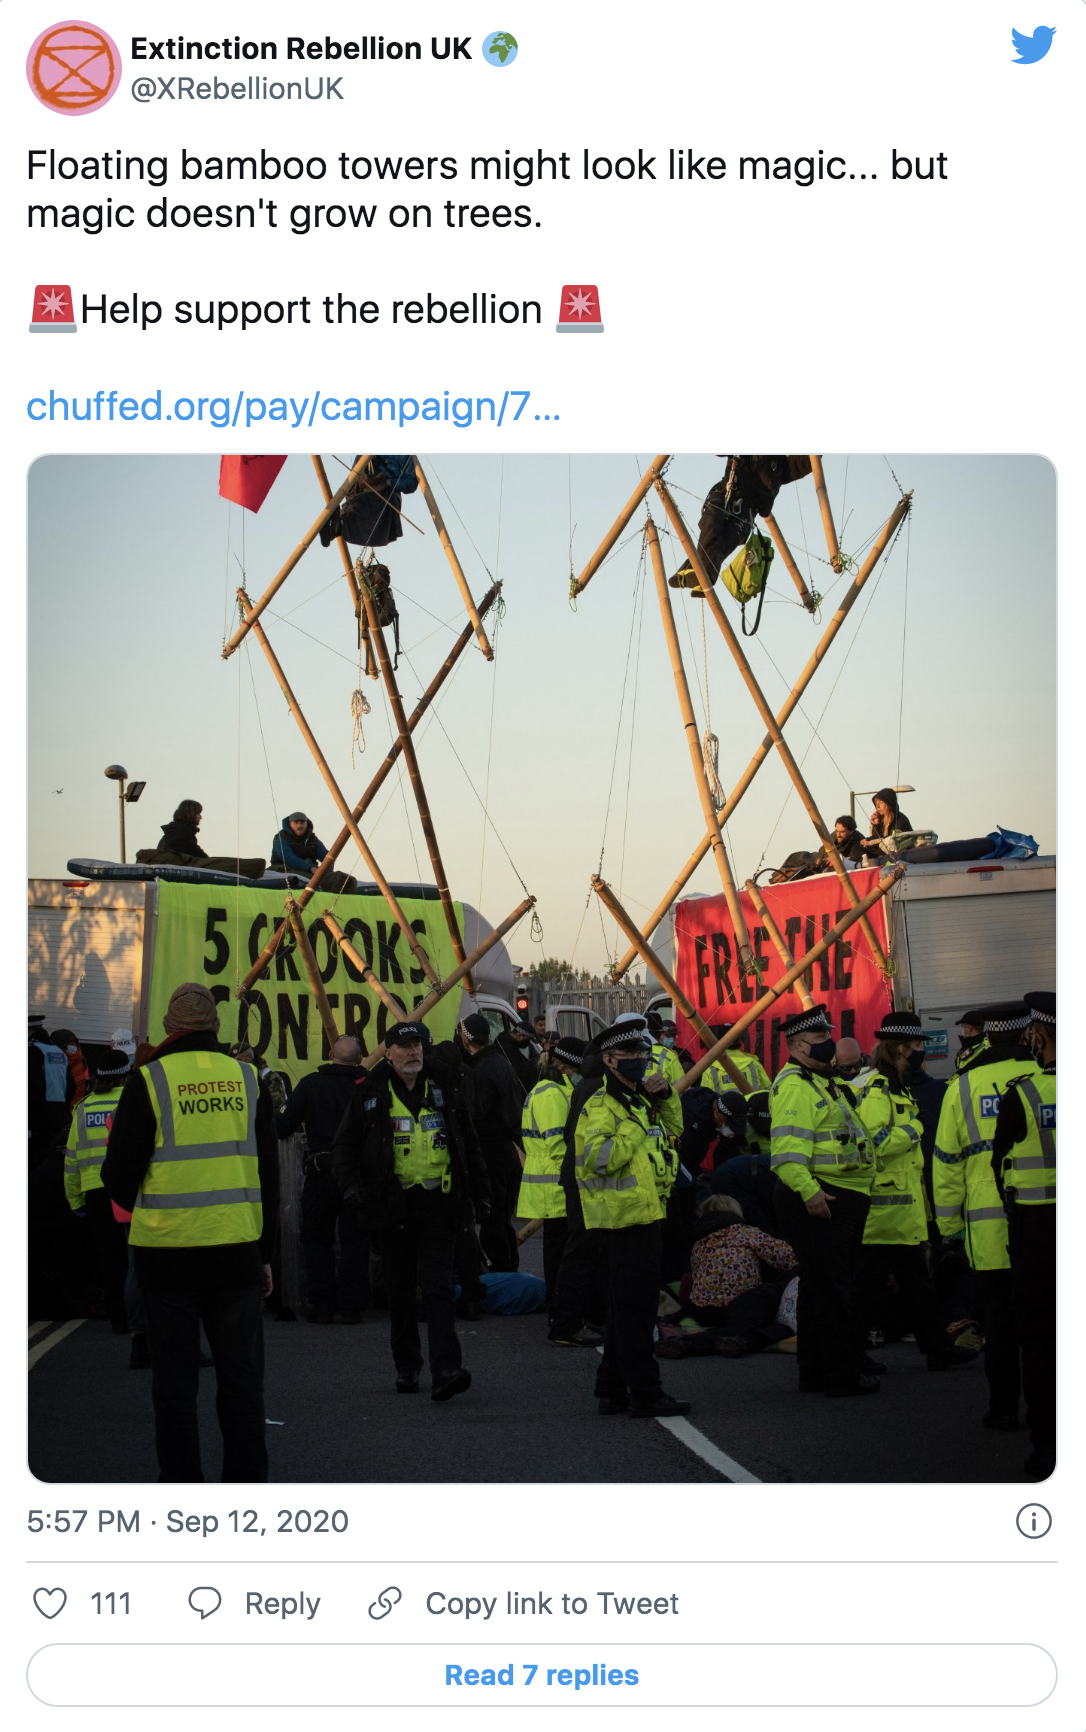
Extinction Rebellion’s use of tensegrity structures to block streets were an elaborate architectural twist on (usually ad-hoc) protest barricades and structures and appeared to provoke swift police action against similar structures. Other artists have proposed design fictions that similarly break algorithm-run transport networks or city surveillance. James Bridle’s Autonomous Trap 001uses paint to disrupt the sensors of driverless vehicles, leaving them trapped in a glitched pattern of street markings. And ScanLab’s Stealth Objects tackle LiDAR mapping, with proposed ornamental sculptures crafted in such a form that it disorients scanning attempts and creates noise-filled voids. Graffiti tagging achieves similar, disregarding norms of ownership: property owners, real estate markets, and services such as Proportunity or Zillow mark it as a signifier of lower value; a worse neighbourhood score. But for graffiti, and for many of the above examples, for those ‘in the know’, they are not nonsense or glitch: they are an art form or language only legible to other local community members.
We can look to cartography to practice this glitch-making on a wider scale. The GPS underpinning all apps and datasets (and the Euclidean geometry of their logic) has a long colonial history of being used to envelope all land in terms of territory and ownership. Its antecedents include countless examples of geographic- and community-specific modes of land and community cartography: including indigenous, feminist, and situationist mapping, each offering non-Euclidian, emotive, ephemeral means of charting a peoples’ knowledge. While it is important not to naïvely idealise pre-colonial or queer identities, communities, or practices as strategies (since this only appropriates anew), it is worth noting the many highly effective, purposefully, personal or communal ways in which such communities have both ‘refused’ to be legible to colonisers, and recorded entire cultural knowledges and values wholly unrecognisable to these colonisers, or their software.

SCANLAB
This is the “glitch” not as a mistake, but as an embrace of that which is deemed unnecessary, irrational, unquantifiable by Western philosophy and politics. More importantly, it is local: taking the form of tangible visual and participatory cultures, interventions, and activities installed upon, painted over, and acted out within the city. It is an “anarchitecture” of “social, spatial, and structural interventions” that are purposefully spontaneous and grassroots responses to algorithmic urbanism.
Design alone won’t save neighbourhoods from the gentrifying tendencies of urbanism tech. But if real estate and public authorities and private interests continue to treat the city as a spreadsheet, trusting it to be read, charted and optimised by machine vision, then it’s not enough simply to gain access to or modify that information. This data is the product of someone else’s tools. It is created for an abstract, systematised and aesthetically homogenous non-place that serves a deeply normative political project. We don’t need this data or this relationship with our cities. What we need is situated glitch urbanisms and communities that thrive on the ephemeral, localised aesthetics and knowledges that don’t fit in a dataset or datastore. What we need is to push the city outside of the machinic view.
Cities After Algorithms
Cities After Algorithms is a content series exploring how algorithms generate and influence the spaces we live, work and move around in. Algorithms shape the city after their own image, but it is an image they have been trained to see. The tendency to mistake collected data for reality produces a self-fulfilling prophecy by leaving little room for intervention, experimentation or otherness. The more this technological determinism rules the use and design of cities, the more the city will be organised after mechanical parameters instead of socio-political ideals. The special series Cities After Algorithms is produced in collaboration with Failed Architecture, and is supported by the Dutch Creative Industries Fund.